Tip
The control panel can be collapsed or made visible using the hamburger icon (three horizontal lines stacked on top of each other ) on the left end of the toolbar.
Control Panel
The control panel allows users to select variables from the simulation data file as well the spatial and temporal ranges of data to visualize, as explained below.
Variable selection
Variable categories
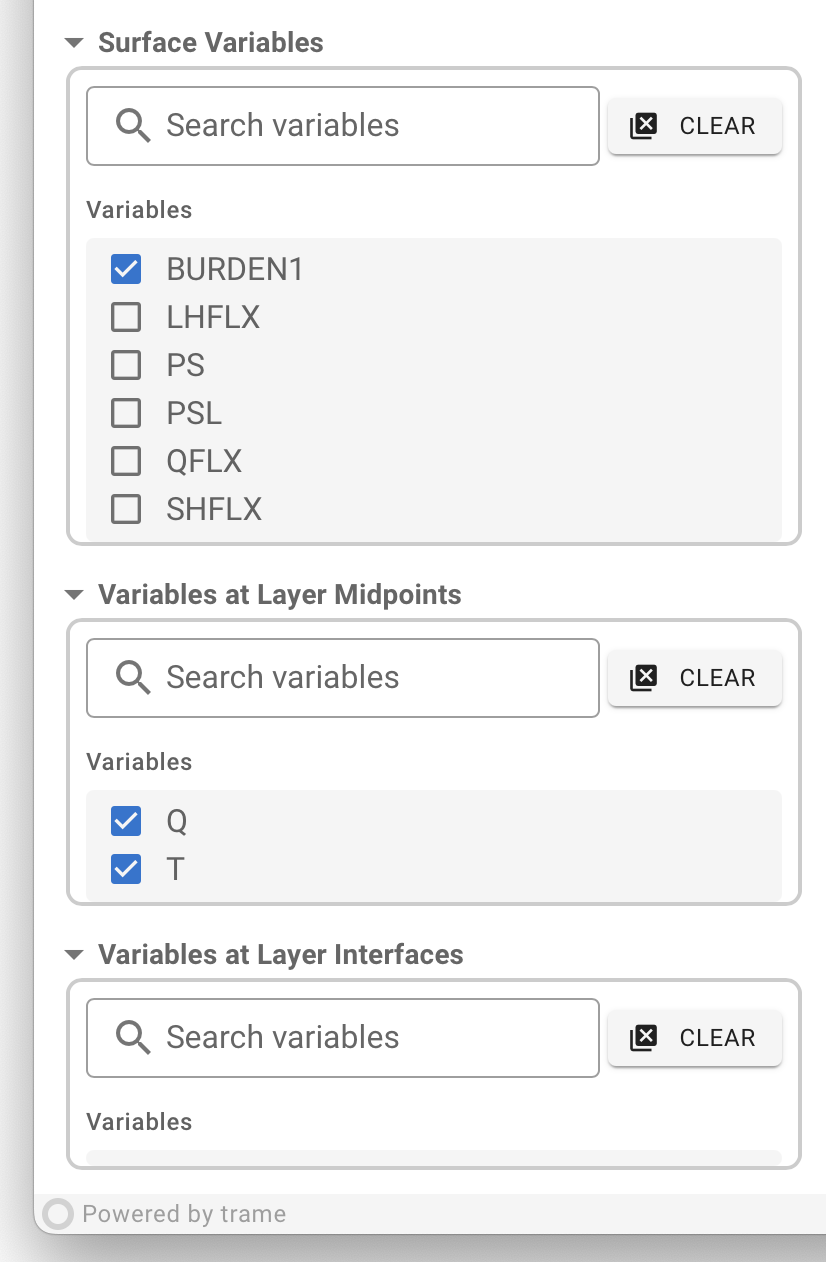
EAM's simulation output files typically contain many variables corresponding to physical quantities with spatial coverages over the entire globe.
- Some of those variables may not have a vertical dimension; these are referred to as "surface variables" in our app.
- Some of those variables have "lev" or "ilev" as the vertical dimension; these are referred to as "variables at layer midpoints" and "variables at layer interfaces", respectively.
The three variable categories each have their own collapsible submenu in the control panel, as shown in the screenshot here. Variables of other dimension sizes are currently igored by the app but can be supported upon request.
Select and load
The LOAD VARIABLE button
After a selection of variables is made or changed, the LOAD VARIABLES
button in the toolbar must be clicked in order for the
(new) selection to take effect.
In contrast, all other buttons, sliders, and text boxes
apply their effects immediately upon user interaction.
After a simulation data file and a connectivity have been loaded and
the status icon in the toolbar has turned into a green
circle with a check mark,
the variable selection submenu of each variable category,
if expanded, will show a list of variables that have been recognized
by the app, as shown in the screenshot above.
Checking the boxes to the left of the variable names
and then clicking the LOAD VARIABLES button in the toolbar
will render contour plots in the viewport.
Variable search
EAM output files often contain a large number of variables, resulting in long lists in the varaible selection submenus. In such cases, the user can hover their cursor over the list and then scroll up and down to review the full list.
Typing a string in the Search variables box and then hitting
the return key on the keyboard will
replace the full variable list by a filtered list.
Clicking the CLEAR button in the submenu will unselect all
variables in the category.
Here, we emphasize again that any changes in variable selection needs to be
followed by a click on the LOAD VARIABLES button in the toolbar
in order for these changes to take effect.
Data slice selection
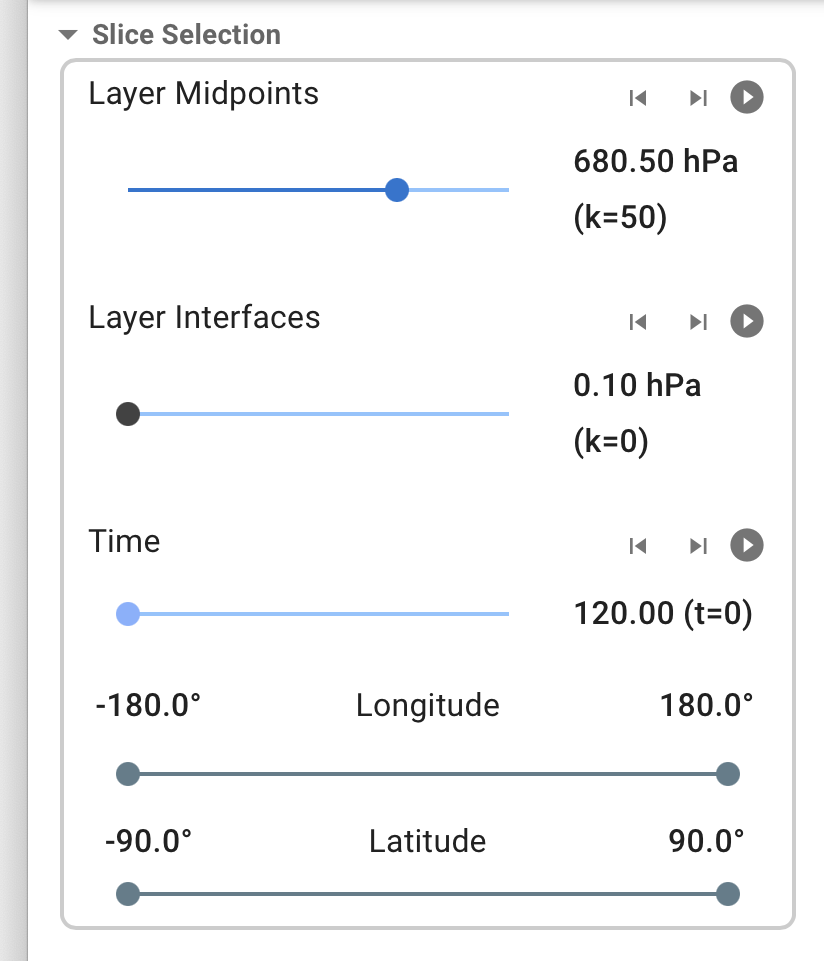
To keep the QuickView app lightweight and easy to use, we decided to only support color-filled contour plots of the globe or a latitude-longitude box. The slice selection portion of the control panel provides a set of sliders for the user to select which vertical levels, time levels, and latitude-longitude ranges to create contour plots for.
For the vertical dimensions and the time dimension, the control panel also provides buttons for moving to (displaying) the previous or next element in the dimension, as well as "play"/"pause" (toggle) buttons for cycling over these dimensions or pausing the cycle. If the user clicks on a second "play" button when the app is cycling through a first dimension, then the cycling in the first dimension will be paused.
Map Projection
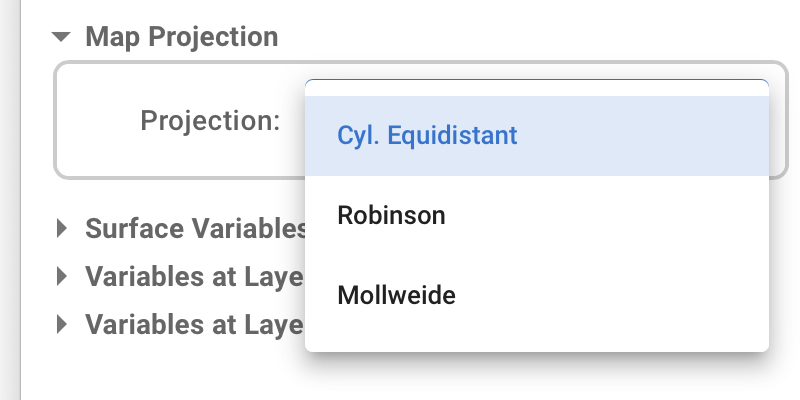
QuickView currently provides a very simple map setting submenu that contains a few commonly used map projections. More projections can be added upon request. In the near future, the center longitude of the map will become customizable.