Toolbar

The toolbar located at the top of the GUI contains UI elements (buttons and text boxes) that control global features of the current visualization session, "global" in the sense that they affect the overall appearance and state of the GUI, including all views of physical quantities displayed in the viewport. In the following, we first explain in detail the UI elements that support the two modes of usage of the app, new-viz and resume, and then introduce the other elements.
New-viz mode: starting a new visualization
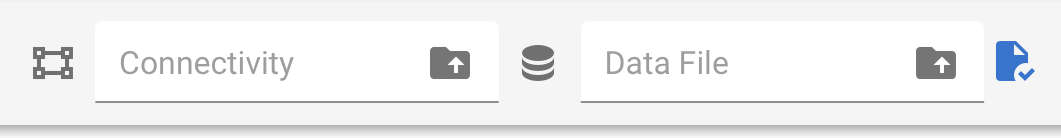
To start a new analysis/visualization, the user needs to specify a connecitivy file and a simulation data file using the portion of the toolbar shown here, by either pasting/typing the file paths and names in the corresponding boxes or using the file folder icons to bring up system dialogue windows to select files.

After both files have been specified, the Load Files button
next to the Data File box
(i.e., the icon of a page with a check mark) must be clicked.
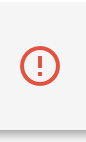
If the red circle with an exclamation
mark shown in the picture here becomes a green circle with a check mark,
the files have been loaded and the ParaView Reader behind the GUI has
identified variables in the data file that the app can visualize.
The user can then start using the control panel to select
variables and spatial/temporal slices to display.
Tip: File Loading Error
After the Load Files button is clicked,
if the red circle-and-exclamation icon persists,
then the variable dimensions in the data file
are not parsed correctly. Below are some common reasons for the error:
- The data file and the connectivity file correspond to different cubed-sphere grids. E.g., one is ne30pg2 and the other is ne4pg2.
- The data file is missing some of the coordinate variables needed by the app, or the dimensions are named or ordered in ways not yet known by the app, see data format requirements.
Resume mode: pick up where you left off

The current state of the visualization can be saved—and reloaded later to
resume the analysis—using the Save State (downward arrow)
and Load State (upward arrow) buttons shown here.
For loading a state, the upward arrow button brings up a window for
the user to select a state file from the computer. After the file
is selected and the Open button in that dialogue window is clicked,
the app will immediately start loading the state; the user is not
supposed to click on the Load Files button designed for the new-viz scenario.
If the state file is successfully loaded (the contents are correctly parsed),
the red circle-and-exclamation icon will turn into to a green circle-and-check-mark icon,
like in the new-viz mode. Loading a state for an ne30 simulation
usually takes a couple of seconds.
Info: What's in a State File?
A state file is a JSON file that contains the paths and names of the connectivity and data files being used as well as the settings the user has chosen for the visualization; the contents of the connectivity and data files are not included. If a state file is shared among multiple users or used across different file systems, or if a user wants to apply the same visualization settings to a different simulation data file, then the file names and paths at the beginning of the state file need to be edited before the state file is loaded in the app.
Tip: State File Loading Error
If the app seems nonresponsive after a state file has been chosen
and the Open button in the dialogue window has been clicked,
there is a high chance that the paths and names of
the connectivity and simulation data files contain errors.
The user should consider using a text editor to inspect the first
few lines of the state file and verify correctness.
Other elements of the toolbar

Control Panel Hide/Show: The hamburger icon (three stacked lines) at the left end of the toolbar hides or shows the control panel.

Busy Indicator: The gray circle is a busy indicator. When a rotating segment appears, the app is processing data in the background—for example, loading data files or a state file as explained ealier on this page, or loading newly selected variables (see description of the control panel).
LOAD VARIABLES:
The LOAD VARIABLES button, when clicked, executes the action of loading
the user-selected variables from the data file and
displaying them in the viewport.
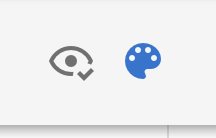
Colormap Groups: The eye icon is a toggle for loading a group of colorblind-friendly colormaps to the GUI for the user to choose from in the viewport; A lot of these colormaps are from Crameri, F. (2018). The paint palette icon is a toggle for loading a set of colormaps that may not be colorblind-friendly; Currently, these are "presets" from PareView.
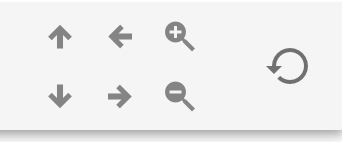
Camera Actions: A set of buttons are provided to simultaneously adjust all views in the viewport: move them up, down, left, or right with respect to the GUI, zoom in or out, or refresh all contents in the viewport so that the contour plots are recentered and resized to their individual frames.
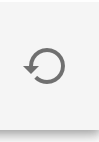
Tip: Camera Refresh for Addressing Display Error
As mentioned on the Reminders page, the app may exhibit
display issues after new variables are loaded or when visualization
settings are changed.
In those cases, a click on the Camera Reset button at the right end
of the tool bar should reload the visualization
properly, and we are working on resolving the display problem for future releases.